Climate Change Commitment

Climate change 'commitment' is the term used by scientists to convey the fact that we are locked into a much higher degree of global climate change than we we're already experiencing today.
The IPCC A5 says we are absolutely committed to a warming of 1.5C from 2030 to 2040. By today's levels of atmospheric GHGs the AR5 says we are committed to 'about 2C', but could still get under 2C.
The UN negotiations are now treating the 2C limit as only to 2100. This is wrong because 2C at 2100 is locked in to 3.5C after 2100 (about another 75%).
Commitment is fundamental to understanding our planetary state of emergency.
The graph above, from the 2001 IPCC assessment, shows that even with emissions at virtual zero carbon (which it takes to stabilize atmospheric temperature and ocean acidifcation ) global temperature increase slows but does not stabilize for many centuries, over which time there is more warming and climate change.
Climate change future commitment is the result of climate system inertia due to long lag times, mainly from the heat storage of the vast oceans. The climate system is characterized by great inertia and great momentum under forcing.
There is no single definition of commitment. The IPCC presents three definitions of commitment, saying that none them are the full "unavoidable commitment."
It is because of commitment that global warming and climate change impacts will be far greater than we are experiencing today (even with an emergency response) and will last thousands of years.
In practice climate change science refers to commitment modeled from the ocean heat lag and the ultra long lifetime of large amount of CO2 emissions.
The vast ocean water has absorbed 95% of the heat from industrial-age GHG emissions. The ocean water absorbs heat slowly and gives up heat to the planet's surface very slowly. In this way, the oceans store heat for a long time. The graphic below is from the IPCC 2007 assessment, to show that warming will continue even if the GHG concentrations could instantly increasing at 2100

A List of Unavoidable Sources of Warming
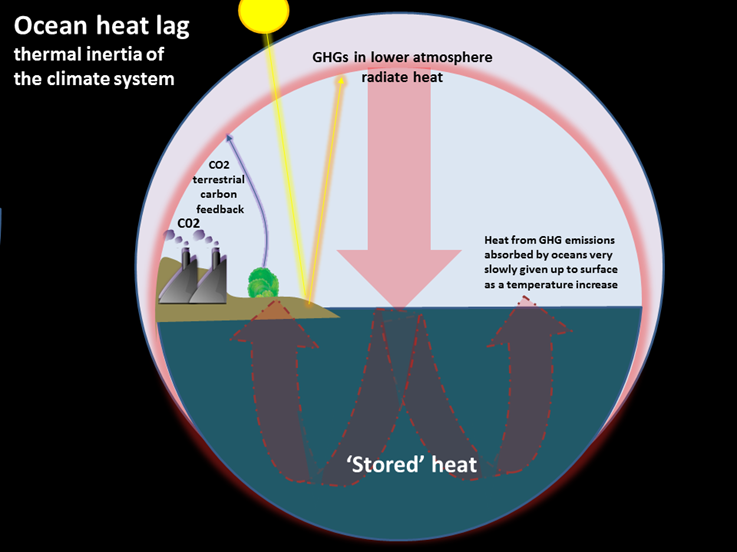
The first image above shows the ocean heat lag.
Here are all the sources of committed global warming:
1. Today's warming - 1.0ºC
2. Time taken to stabilize atmospheric greenhouse gases
This is socio-economic-technological inertia. Clearly with no new mitigation measures on the world climate change agenda until after 2020 and nothing planned, this is an inertia of decades. As the IPCC 2014 AR5 says, in order to stabilize atmospheric CO2, industrial carbon emissions must stop (zero carbon). The best-case IPCC scenario to zero carbon is 70 years. James Hansen puts this additional committed warming at 0.6ºC. The published science on how fast we could get down to zero emissions is 25 years (Jacobson & Delucchi, 2011; Delucchi & Jacobson, 2011).
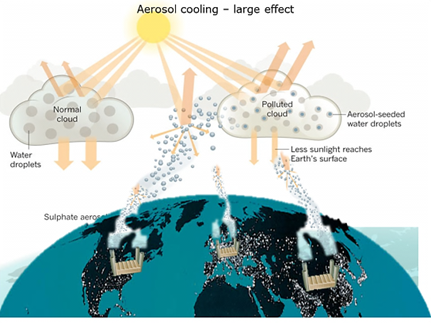
3. Deferred warming from unmasking air pollution aerosol cooling
We all know that burning fossil fuels produces air pollution, which causes and contributes to a myriad of very costly health disorders. Black carbon (soot) particulates is a large contributor to global warming, but the acid air pollution aerosols are large source of global cooling. Because these pollutant emissions have to be reduced for air quality and virtually stopped for climate change and ocean acidification mitigation, the hidden warming will be 'unmasked' and the global temperature will rapidly rise. The amount of this cooling is very uncertain but estimated at about 0.4ºC. (see image bottom of page)
(Ramanathan and Feng were published in PNAS 2008 pointing out that the prevailing science, which does not account for this deferred warming, is wrong, and calculated that the commitment due to the ocean heat lag and deferred aerosol warming (for a high aerosol warming) is 2.4ºC.
4. Ocean heat lag
The ocean heat lag and prolonged effect of CO2 emissions over thousands of years, about doubles the realized/transient warming (0.8ºC to date) at the time of atmospheric greenhouse gas stabilization, according to the National Research Council 2010 Climate Stabilization Scenarios, which is the same as the first IPCC estimate in 1990. The IPCC AR5 estimates it at another 75% of today's warming.
5. Amplifying positive feedbacks
At 2.0ºC or less, positive amplifying feedbacks will be driving up global warming on top of our emissions. The higher the atmospheric GHG emissions and the longer they last, the more will be the extra feedback warming.
i) Albedo loss
The melting of snow and ice from global warming results in a positive amplifying feedback because snow and ice reflect back out to space solar energy that otherwise would become infrared heat energy on contact with the planet's surface. This planetary cooling property of snow and ice is called albedo. We are rapidly losing Arctic albedo and the summer sea ice has passed its ice-free tipping point (James Hansen, Tim Lenton). We do not have an estimate for how much this will boost global warming. Arctic sea ice disappearance and ice sheet albedo loss would be a huge amplifying feedback, called the "albedo flip" by climate scientists.
The 2ºC almost universally accepted policy originates with a 2ºC European Union policy limit that was a dangerous compromise meant to (according the EU) "minimize" but "not exclude" the risk of runaway global warming. We estimate the amplifying feedback caused by a 2.3ºC warming.
ii) Carbon feedback
There are two classifications of carbon feedbacks:
1. Terrestrial carbon feedback of warming soil and vegetation emitting more CO2 than taken in. There is a very large number of planetary surface carbon feedback sources.
2. Peat and Arctic carbon feedbacks that are not included in terrestrial carbon (and for which there are relatively few published model results).
In the case of the very large carbon deposits in peatland and Arctic permafrost, carbon feedback research requires more data than we have now in order to establish how much carbon will be released as CO2 and methane under more warming.
The other enormous Arctic source of carbon feedback is subsea floor frozen solid methane gas hydrate and free methane gas deeper in the sediment. This is the largest single source of carbon vulnerable to warming, but has not been researched enough to know just how much.
As a result of the high global warming commitment, it may now impossible to avoid going above the 2ºC international policy target without removing substantial amounts of CO2 from the atmosphere for a prolonged period (hundreds of years).
Images below
1. Illustration of ocean heat lag from carbon emission to global average temperature increase from the emission registering as a global average temperature at the planet's surface. It takes 30-50 years for the heat from the GHG emission to be distributed throughout the World Ocean and to register at the surface. If we stop all carbon emissions, atmospheric CO2 will stabilize over time (decades), but the stored ocean heat from all past emissions will keep giving up heat to the surface. Over hundreds of years, this will be about double the temperature increase at the time of atmospheric CO2 stabilization.
2. Graph from IPCC 2001 showing the generic relationship between reducing carbon emissions/atmospheric CO2, global temperature, and sea level. Note that even with carbon emissions reduced to virtual zero, global temperature does not stabilize for hundreds of years. As CO2 emissions are being reduced, the global temperature continues rising at a significant rate.
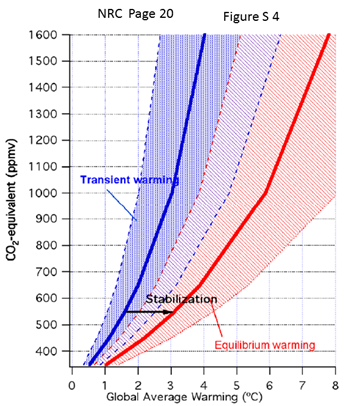
3. Graph from NRC Climate Stabilization Scenarios (2010) showing how the realized or transient warming is about half the full long-term "equilibrium" warming. The example shown is stabilization at 550 CO2eq ppm (CO2 equivalent adds in methane and nitrous oxide) at which time the transient warming is 1.5ºC. The planet will continue warming (slowing down) to reach 3ºC. Therefore we know that the ocean heat lag commits us to more than double today's warming — we have not even started to try reducing emissions and there is no plan for zero emissions.
4. Illustration of fossil fuel air pollution acid aerosol cooling, which causes global cooling by a direct albedo effect and an indirect cooling effect on clouds.
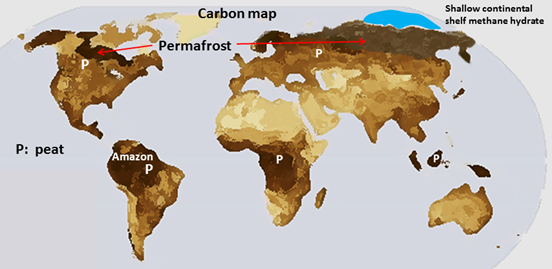
5. World carbon map. Sub sea floor methane hydrate, permafrost and wetland peat are the largest carbon stores on/in the planet. They are not included in terrestrial carbon models. Most permafrost is in Siberia. Permafrost holds double the carbon of the atmosphere. Arctic methane hydrate holds more than atmospheric carbon. Terrestrial carbon is the rest of the planet's soil and vegetation, which has been modeled. Along the southern region of the permafrost and the peatland below grows the Boreal forest, which holds more carbon than the Amazon.


The 2016 Planetary Health Alliance (2019 VIDEO)
Video Dr. H. Montgomery's 2018 lecture says it all
Lancet Countdown (Nov)2018 Report for policy makers
2017 WHO 5th Climate & Health Summit
2014 Lancet From Public to Planetary Health:
A Manifesto
2014 BMJ Climate Change & Human Survival
2014 BMJ Climate Change
is a Health Emergency
IPCC 5th Assessment
Climate & Health Council