STATE OF THE CLIMATE
This page lists state of the climate evidence* that the world is far beyond dangerous climate interference (UNFCCC) and into a dire state of emergency with respect to regionally vulnerable populations today and all future generations,
of all species.
Visit the monthly State of Our Climate site for up-to-date information.
Data here up to 2016 from the US NOAA and the IPCC.
The main greenhouse emissions contributing to global warming in order of effect on global temperature:
- Carbon dioxide (CO2)
- Black Carbon (BC) or soot (recent research)
- Methane (CH4)
- Tropospheric(ground level) ozone (O3)
- Halocarbons (manufactured chemicals)
- Nitrous oxide(N2O)
As the temperature graph below shows the increasing global average surface temperature that slowed over the past decade is now increasing extremely fast.
That slowing did not mean global warming stalled - surface warming was sustained at the same elevated heating. Ocean heating kept accelerating. The melting of ice (Greenland and other glaciers), the decline in Arctic summer sea ice, and the thawing of permafrost carried on, and at an accelerating rate. Damaging global warming driven extreme weather events continued. The trend over the past 50 years is a very rapid surface temperature increase.

The increasing (accelerating) atmospheric concentration of CO2 correlates directly to the increasing radiative (heat) forcing from the atmospheric accumulation of CO2. Constant sea level rise and glacial melting are clear indicators of heating.
Established Methane Feedback
An alarming recent deterioration in the climate change situation is the renewed sustained increase in atmospheric methane, because this increase in part is due to planetary feedback methane emissions (from warming tropical wetland peat).
Methane has 86 times the global warming capacity of CO2 over a 20 year period.

Atmospheric CO2 has increased 40%, which is the highest in 800,000 years (ice core data) and in 15 million years (ocean sediment data). It is 30% higher than its 800,000 year (ice core) maximum. Methane has increased far the most, by 160%. It is more than double its 800,000 year maximum. Nitrous oxide right now is increasing fast. It has exerted the lowest heating effect, but is important as it lasts in the atmosphere for 114 years and has a heating effect (GWP) of 289 (times CO2).
The image below from the IPCC AR4 2007 assessment is a most useful one, because it shows the simple fact that the amount of additional GHGs that have accumulated in the atmosphere correlates directly with the heat added to the climate system (radiative forcing).
The sudden large increase in atmospheric GHG concentrations and radiant forcing is dramatic. It is an abrupt unprecedented heating of the planet.
As IPCC AR4 reported in 2007 "the recent rate of change (in atmospheric CO2) is dramatic and unprecedented; increases in CO2 never exceeded 30 ppm in 1 kyr – yet now CO2 has risen by 30 ppm in just the last 17 years." http://www.ipcc.ch/publications_and_data/ar4/wg1/en/faq-7-1.html

State of the Climate: Past Climate Trends

Over hundreds of thousands of years, an equilibrium between atmospheric carbon dioxide input and removal was never more than one to two percent out of balance. This natural feedback acted as a thermostat — critical for the long-term stability of the climate, which allowed life to evolve and thrive on this planet.
During Earth's history, this equilibrium has probably helped to prevent runaway greenhouse and icehouse conditions over timescales of millions to billions of years, a prerequisite for sustaining liquid water on Earth's surface.
- The maximum imbalance between the amount of CO2 put into the atmosphere and the amount taken out of it during the last 610,000 years was 1 to 2 percent, or 22 parts per million. That one or two percent imbalance is thousands of times smaller than our current emissions from industry and the destruction of forests (Zeebe & Caldeira, 2008).
- Humans have increased the quantity of carbon dioxide 14,000 times more (to 400 ppm) than any natural process is capable of doing (Carnegie Institution for Science, 2008).
- The amount of CO2 humanity is releasing into the atmosphere today, through human activity, is 100 times more than what came out of the Siberian volcanoes 250 millions years ago, causing the Permian extinction, referred to as "The Great Dying" (paleontologist Peter Ward, quoted in Bushnell 2010).
- The current rate of global warming exceeds anything in the past 5,000 years, over which time human agriculture and civilization developed (Greene, 2008).

- Global CO2 and methane levels are the highest in at least 800,000 years (Lüthi et al, 2008), according to direct ice core measurements (explained in the graph above by Brook, 2008).
- Global CO2 levels are possibly the highest they have been in 20 million years, according to ocean sediment analysis (Pearson & Palmer, 2000).
- We have reached an atmospheric CO2 level of almost 400 ppm, as measured by the Mauna Loa Observatory in Hawaii (widget above is updated monthly, or visit CO2 Now to learn more) from a pre-industrial level of 280 ppm.
- Methane has 84 times the heating effect of CO2 over 20 years after emissions (IPCC, 2007b). A unique aspect of methane is an atmospheric feedback: The higher its atmospheric level becomes, the less methane is oxidized in the atmosphere and so the more rapidly its concentration will increase. This is because, unlike CO2, methane is chemically reactive in the atmosphere and as a result only lasts about 12 years. However, its heating does not stop because it is converted to other greenhouse gases: water vapour, CO2 and ozone (Boucher et al, 2009).
- After stabilizing in 2000 at 2.5 times its pre-industrial level, since 2007 atmospheric methane has been on a renewed sustained increase, but this increase is in part due to planetary feedback emissions. (Rigby et al, 2008) (Le Quéré, 2007).
- This increase in atmospheric methane started as a result of carbon feedback feedback methane (CH4) from anomalously high temperatures in the Arctic and greater than average precipitation in the tropics, rather than from increased industrial emissions. (Dlugokencky et al, 2009). Since then the feedback has been from tropical wetlands
- Nitrous oxide (N2O) is an extremely potent greenhouse gas that is approximately 300 times more powerful than carbon dioxide over its 120 year lifetime in the atmosphere (EPA, 2010).
- Atmospheric nitrous oxide has risen to its highest in 800,000 years (Schilt et al, 2009).
- Of the five long-lived greenhouse gases that contribute 96% to radiative climate forcing, CO2 and N2O are the ones that continue to increase at a regular rate (NOAA, 2009a).
State of the Climate: What is Happening Now?

The greatest of all global warming dangers is carbon feedbacks, whereby the warming planet adds more carbon to the atmosphere as a result of being warmed.
Most of the largest planetary sources of amplifying feedback are Arctic and operant. David Archer has pointed out that there is more carbon on the planet than ever before in Earth's long history.

According to computer modelling and science, an increase of both 1.5ºC (to which we are committed) put us beyond what the United Nations Framework Convention on Climate Change calls "dangerous interference with the climate system," and into a rapidly worsening planetary emergency, which is threatening the future of humanity and the rest of life on Earth.
- Since the instrumental record began, the climate has never been hotter to 2016.
|
"Based on comprehensive data from multiple sources, the report [State of the Climate in 2009, which gives actual observed climate trends — perhaps a better guide for understanding the climate change situation than computer model projections*] defines 10 measurable planet-wide features used to gauge global temperature changes. The relative movement of each of these indicators proves consistent with a warming world. Seven indicators are rising: air temperature over land, sea-surface temperature, air temperature over oceans, sea level, ocean heat, humidity, and tropospheric temperature in the 'active-weather' layer of the atmosphere closest to the Earth's surface. Three indicators are declining: Arctic sea ice, glaciers and spring snow cover in the Northern hemisphere." (NOAA, 2010b) |
- We have reached a globally averaged temperature increase of just over 1.0ºC (2015) since the pre-industrial era.
- Scientists consider a global warming of 6ºC to be a threat to the survival of humanity, and anything beyond an increase of 2ºC to be intolerable (as recorded at the Asia-Europe Summit by Khor, September 2006).
- Global warming "could lead to abrupt or irreversible climate changes and impacts" (IPCC, 2007a and 2014 AR5).
- The level of atmospheric CO2 is rising at an accelerating rate (Scripps 2015)).
- Nitrous oxide is expected to be the dominant ozone-depleting substance emitted in the 21st century (Ravishankara et al, 2009). Several ozone depleters are also greenhouse gases; ozone depletion and global warming are known to exacerbate each other (Shindell et al, 1998).
- Global warming will last thousands of years .
Research by Susan Solomon proves global warming and climate change will last over a thousand years (Irreversible climate change due to carbon dioxide emissions S. Solomon PNAS 2009). As the IPCC says elevated CO2 will stay elevated for millennia, global warming has to last thousands of years.
Atmospheric industrial GHG pollution is rapidly changing the Earth for ever - very much for the worse.
There is always a large amount of "hidden heat" circulating in the world's oceans. This "in the pipe" ocean heat lag commits us (locks us in) to another 75% and eventually a possible doubling of any "present day" increase in global temperature. This applies so long as the atmospheric GHGs are not stabilized.

The danger, therefore, to all future generations is always more than double the danger to the present generation at any particular point in time (up to atmospheric GHG stabilization).
- Due to the ocean heat lag, today’s global warming of 0.85ºC far into the future is going to almost double (NRC 2011 Climate Stabilization Scenarios). Over the next 100 years it is committed to increase about 75%.
- Today’s absolutely committed global warming by 2100 due to the ocean heat lag alone is 1.5ºC, which will occur by 2030-2040 (IPCC, AR5). This is an extremely dangerous level of global warming with respect to global ecosystems, agriculture, water supplies, diseases, sea levels and worst of all amplifying feedbacks.

- Atmospheric CO2 level will increase until global fossil fuel emissions are cut to virtually zero (IPCC AR5 2014).
- Ground level (tropospheric) ozone is toxic to human health, and also green plants (so crops). It is a greenhouse gas created when sunlight and heat react with pollution from combustion engines, has contributed to global warming almost as much as methane has. Concentrations of ozone have risen by around 30 percent since the pre-industrial era and it is now considered by the IPCC to be the third most important greenhouse gas after carbon dioxide and methane (NOAA, 2010c). An additional complication of ozone is that it interacts with and is modulated by concentrations of methane (Johnson et al, 2001).
- Global warming increases the formation of ground-level ozone, which damages plant health (a carbon feedback) as well as human health (IPCC, 2007b; Ebi & McGregor, 2008).
- Modern day concentrations of ground level ozone pollution are decreasing the growth of trees in the northern and temperate latitudes (Wittig et al, 2008). By inhibiting carbon update by plants, tropospheric ozone increase is projected to be a significant carbon feedback (Sitch et al, 2007).
- The latest and most complete climate model for A1FI (Prinn et al, 2008) run by MIT for the IPCC's worst case scenario (which our current GHG emissions surpassed in 2005) shows a 7.6ºC warming by 2100, from 1900.
- The growth in carbon emissions is being driven by partly human population growth (Hofmann et al, 2009) and mainly fossil-fueled economic growth in global GDP, as shown on the graph below (NOAA, 2009b).

- What is the danger limit for survival of human populations from heat alone (not water or food)? It is 6.0ºC to 7.0ºC. For the first time, this most important of all questions has finally been answered (Sherwood & Huber, 2009).
|
"Seven degrees (global average temperature increase) would begin to create zones of uninhabitability due to unsurvivable peak heat stresses [periods when the shedding of metabolic heat is thermodynamically impossible] and 10ºC would expand such zones far enough to encompass a majority of today's population." The authors explain that it is now "widely assumed that humans can adapt to any amount of warming, on the basis that humans live in such a wide variety of climates now.... but the limits themselves rest squarely on basic thermodynamics." (Sherwood & Huber, 2009) |
|
Crops are like humans in heat and water deprivation sensitivity. Too much makes them wither and die. At a global warming of above 1.0-1.5C IPCC AR5 crop model results show all crops in all regions have declined below today's output. At 2C all crops in all regions are under severe to extreme summer heat and drought (DAI Drought Under Global Warming 2010). It is safest to assume that world agriculture would collapse at a 2C to 3C warming. |
- How likely, then, are we to reach a temperature increase of 7ºC? Researchers at the UK Met Office's Hadley Centre (see Pope, 2008) project that if we continue "business as usual" (that is, continuing to take no action to reduce greenhouse gas emissions), we could see a 5.5ºC to 7.1ºC rise in global temperature by 2100. This is twice the global warming projected by the 2007 IPCC assessment*. "This would lead to significant risks of severe and irreversible impacts." Pope explained that these projections do not include methane release that will occur as temperatures rise. "Hence, the risks of dangerous climate change will not increase slowly as greenhouse gases increase. Rather, the risks will multiply if we do not reduce emissions fast enough.... For every delay of 10 years in achieving peak emissions, another 0.5°C will be added to the most likely temperature rise, unless emissions are reduced even more quickly."
- The time scale of future global climate change resulting from current greenhouse gas emissions is 1000 years (Solomon et al, 2009). Global warming, climate changes (in precipitation levels, for example), and sea level rise are largely irreversible for 1000 years after carbon dioxide emissions cease.
Climate Change Emergency References
State of the Climate: Extreme Weather Events

- There has been a dramatic rise in natural disasters during the past decade, according to the Center for Research on the Epidemiology of Disasters (CRED) (Vos et al, 2010). During the 2000 to 2009 period, there were 385 disasters, an increase of 233 percent since 1980 to 1989, and of 67 percent since 1990 to 1999, according to CRED data. Though earthquakes made up 60 percent of natural disasters from 2000 to 2009, climate-related events, such as droughts, storms and floods, have made up the majority of disasters overall, increasing tenfold since data was first collected in 1950.
- The World Meteorological Organization announced in July 2003 that as global temperatures continue to warm due to climate change, the number and intensity of extreme events might increase (WMO, 2003). In late 2009, they announced that "climate extremes, including devastating floods, severe droughts, snowstorms, heatwaves and cold waves, were recorded in many parts of the world" (WMO, 2009).
- The WMO also notes that "new record extreme events occur every year somewhere in the globe, but in recent years the number of such extremes has been increasing" (WMO, 2003). (The WMO limits the definition of extreme events to high temperatures, low temperatures, and high rainfall amounts and droughts.)
Climate Change Emergency References
State of the Climate: Arctic Climate Feedbacks Kick In
Arctic amplifying +ve feedbacks that are all responding to global warming
- Arctic regional amplification has been happening for years. Global warming melts away more 'albedo' cooling Arctic snow and summer ice, which increases Arctic warming, which melts more snow and sea ice ..tec... The Arctic is warming 3-4 X the global average over the past 30 years and 2X over the past 100 years.
This is the first domino in the Arctic +ve feedback domino effect (Prof. Carlos Duarte) that we are now set up for.
Global feedback effect
- Loss of Far North snow cover albedo cooling
- Loss of Greenland ice sheet ice sheet albedo my melting of ice sheet surface
- Loss of Arctic summer sea ice albedo cooling
- Warming subarctic wetlands are emitting methane (72X CO2 warming.
- Thawing permafrost is emitting methane, CO2 and nitrous oxide (300X CO2). Permafrost holds 2X atmospheric carbon and has thaw-down tipping point of 1.5C (Speleothems 500,000-Year History Siberian Permafrost A. Vaks Science 2013).
- Arctic subsea floor methane. Heat slowly penetrating Arctic permafrost off shore sediments is venting methane to the atmosphere, assumed from hydrate and methane gas. This is a planetary catastrophic risk of its own (The Degradation of Submarine Permafrost and the Destruction of Hydrates on the Shelf of East Arctic Seas V. I. Sergienko Ocean 2012).
")
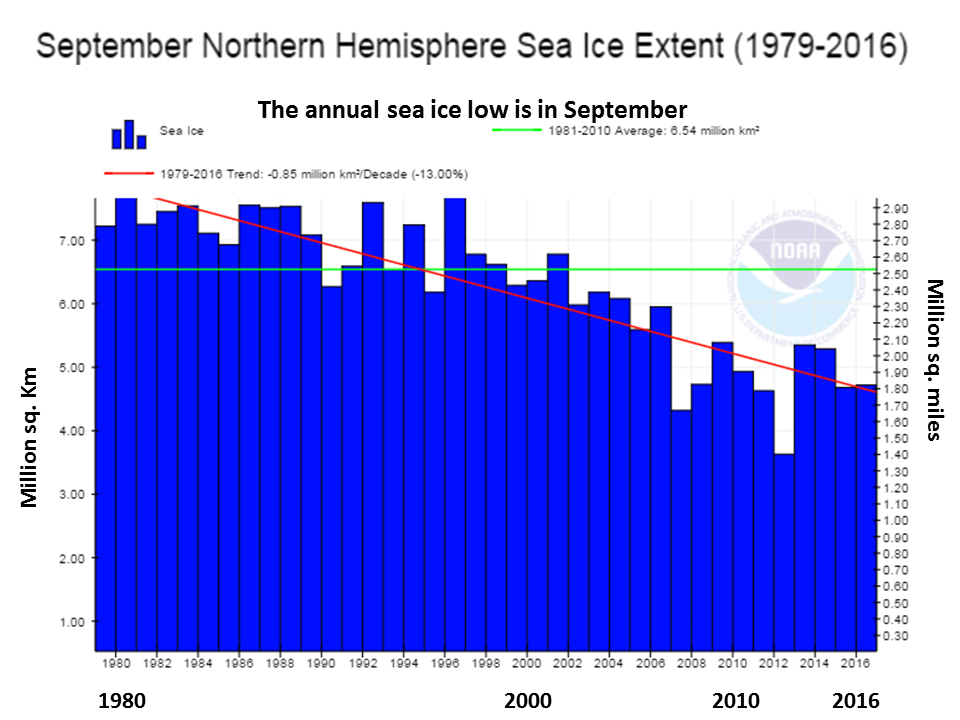
The change in the extent and thickness of Arctic summer sea ice is our greatest danger now because we risk losing its cooling climate-moderating influence on the Arctic, the northern hemisphere and the globe. Once the ice disappears, accelerated regional Arctic warming will accelerate deadly Arctic feedbacks, which means we must make securing year-round Arctic sea ice the top requirement for our safety and for all future generations.
- According to NASA scientists, more than 2 trillion tonnes of land ice in Greenland, the Arctic, Antarctica and Alaska have melted since 2003 (as reported by the Associated Press, 2008).
- Loss of Arctic ice results in loss of regional cooling caused by the reflective albedo effect (NASA, 2008).
- The albedo loss (due to (open water, dark exposed rock and soil) leads to a switch from regional cooling to regional warming, with the warming extending 1500 kilometres inland (Lawrence et al, 2008).
- Analysis of many different types of data collected throughout the world has shown that climate can suddenly flip. The record for abrupt change is roughly 6°C in 1–3 years (with a shift of 10-12ºC over 50 years) recorded in Greenland ice cores (Steffensen et al, 2008).
- The planet is in "imminent peril" from loss of Arctic albedo, which could flip the climate system, leading to cascading runaway Arctic carbon feedbacks (Hansen et al, 2007).
- The loss of Arctic sea ice hit a record for August in 2008 and again 2012 (NASA).
- Arctic ice thickness hit a record low in October 2008 (Giles, 2008) and a record September minimum extent in 2007 and 2012. This means that Arctic sea ice is rapidly decreasing in both extent and thickness.
- What does this mean for future climate?
- The Arctic ocean may be free of ice in the summer within 20 years (Barber, as reported in Leahy, 2008).
or possibly in a decade (When will the summer Arctic be nearly sea ice free? J. Overland1, M. Wang GRL May 2013), or even in a few years according to Prof Peter Wadhams (extrapolating the thickness decline trend), and a model by Wieslaw Maslowski.
The National Snow and Ice Data Center posts daily Arctic sea ice data.
- Arctic soils store tremendous amounts of organic matter. Over millennia, cold, wet conditions have slowed the breakdown of plant material in the Arctic, and large quantities of carbon and nitrogen have built up in permanently frozen ground (Jungkunst, 2010). Carbon feedbacks are now emitting additional carbon (carbon dioxide and methane) across the Arctic as permafrost thaws (United Nations Environment Program, 2008). See the UNEP Year Book 2008 for more information.
- Nitrous oxide is now also being emitted from thawing permafrost. Laboratory experiments show that re-wetting of previously thawed permafrost could increase nitrous oxide production by 20-fold (Jungkunst, 2010).
- By far the most dangerous of all carbon feedbacks and climate changes is the melting of methane hydrates. Methane hydrates are emitting to the atmosphere off the Arctic Siberian coast (Semiletov et al, 2005; Shakhova, 2007).
Methane frozen into hydrate makes up a large reservoir of potentially volatile carbon below the sea floor and associated with permafrost soils. This reservoir intuitively seems precarious, because hydrate ice floats in water, and melts at Earth surface conditions. The hydrate reservoir is so large that if 10% of the methane were released to the atmosphere within a few years, it would have an impact on the Earth's radiation budget equivalent to a factor of 10 increase in atmospheric CO2. Hydrates are releasing methane to the atmosphere today in response to anthropogenic warming, for example along the Arctic coastline of Siberia.
— David Archer, University of Chicago, Department of the Geophysical Sciences (2007)
- Rapid permafrost thaw is occurring, with predictions that the rate of thaw will increase in the future (IPCC, 2007a).
- This permafrost soil, which covers nearly 400,000 square miles (over 1 million square kilometres) of northeast Siberia, averages 82 feet (almost 25 metres) in depth and contains about 500 billion metric tons of carbon, described as a catastrophe in the making (Zimov et al, 2006).
- Regional Arctic warming is projected to triple the rate of permafrost thawing (Lawrence et al, 2008). Previous published research by Lawrence had projected up to 90% of surface permafrost thawed by 2100.
- One million square miles (over 2.5 million square kilometres) of Siberian permafrost is melting (Kirpotin & Marquand, cited in Pearce, 2005).
Climate Change Emergency References
Meltdown Fear as Arctic Ice Cover Falls to Record Winter Low
"...Experts are worried because a long-term slow decline of ice around the north pole seems to have sharply accelerated since 2003, raising fears that the region may have passed one of the 'tipping points' in global warming. In this scenario, warmer weather melts ice and drives temperatures higher because the dark water beneath absorbs more of the sun's radiation. This could make global warming quickly run out of control.
"Walt Meier, a researcher at the US National Snow and Ice Data Centre in Colorado, which collected the figures, said: "It's a pretty stark drop. In the winter the ice tends to be pretty stable, so the last three years, with this steady decline, really stick out." Dr. Meier said there was 'a good chance' the Arctic tipping point has been reached. 'People have tried to think of ways we could get back to where we were. We keep going further and further into the hole, and it's getting harder and harder to get out of it.'
"Dr Meier said: 'For 800,000 to a million years, at least some of the Arctic has been covered by ice throughout the year. That's an indication that, if we are heading for an ice-free Arctic, it's a really dramatic change and something that is unprecedented almost within the entire record of human species.'"
— David Adam, Environment Correspondent, The Guardian, 15 May 2006
- East Siberia's permafrost (the Yedoma) is deeply underlaid with organic matter and ice, and it contains about 500 gigatons (1100 trillion pounds) of frozen carbon deposits that are highly susceptible to disturbances as the climate warms. Once started, irreversible thawing could release 4.4 to 6.2 trillion pounds of carbon per year into the atmosphere between the years 2300 and 2400, transforming 74 percent of the initial carbon stock into carbon dioxide and methane (American Geophysical Union, 2008).
- Field observations suggest that most carbon in the thawed Yedoma will be released within a century (University of Alaska Fairbanks, 2006).
- Permafrost's carbon content is double previous estimates (hence it has twice the atmospheric carbon content estimated), and the permafrost's carbon feedback will dominate as the driver in regional Arctic warming (Schuur, 2008).
- Much more methane gas is being emitted into the atmosphere from the tundra in northeast Greenland than previous studies have shown (University of Copenhagen, 2008).
- Atmospheric levels of methane are spiking due to northern carbon feedbacks (Rigby et al, 2008; reported by Beeby, 2008).
- In response to warmer autumn temperatures due to global warming, nothern ecosystems are becoming net emitters of CO2 (Shilong Piao, 2008).
- Greenland lost an average of 195 cubic kilometres of ice per year between 2003 and 2008, and the melting of Greenland ice is accelerating (Wouters et al, 2008).
Climate Change Emergency References
State of the Climate: Ocean Feedbacks
- The oceans have been acidified by an extra 30% since 1900 at a rate that has not been experienced for at least 400,000 years, probably for the last 20 million years, and possibly ever. This will have further adverse consequences for global climate change (European Geosciences Union, 2008).
- Ocean acidification is growing faster. The acidity has increased more than 10 times faster than had been predicted by climate change models. This increase will have a severe impact on marine food webs (University of Chicago, 2008).
- Dead zones in the oceans are expanding due to global climate change (Stramma et al, 2008).

- The amount of phytoplankton in the oceans is being reduced by global warming and is a potential carbon feedback (Behrenfeld et al, 2006).
- Microscopic phytoplankton account for approximately half the production of organic matter on Earth, and are the base of the marine food chain. Researchers have found that average global phytoplankton concentration in the upper ocean is currently declining by around 1 percent per year. Since 1950 alone, algal biomass has decreased by approximately 40 percent, probably in response to ocean warming — and the decline has gathered pace in recent years (Boyce et al, 2010). A century of phytoplankton decline suggests that ocean ecosystems are imperiled by climate change.
- Through photosynthesis, phytoplankton produce around half of the oxygen in Earth's atmosphere. They also drive the "biological pump" that fixes 100 million tonnes of atmospheric carbon dioxide a day into organic material, which then sinks to the ocean floor when the phytoplankton die (simply stated). What makes this even more catastrophically dangerous is that the ocean biological pump is the only process that can remove carbon from the atmosphere and "sink it" in a long-term, permanent way.
|
"A thriving phytoplankton population would tend to remove more carbon dioxide through photosynthesis than is returned through respiration by the entire community (phytoplankton plus zooplankton and other organisms living in the surface layers), and the ocean works as an effective carbon sink. Conversely, if respiration of the community were to exceed photosynthesis, more carbon dioxide would be generated than is fixed, and the ocean becomes a carbon source." |

Climate Change Emergency References
State of the Climate: Impacts on Coral Reefs
- Coral reefs won't survive past 2050, thousands of scientists, conservationists and policy makers heard at the 11th International Coral Reef Symposium (International Society for Reef Studies, 2008).
- Unless the world gets serious about reducing greenhouse gas emissions in the next few years, it is likely there will be massive bleaching and deaths of corals around the world. This will have significant impacts on the lives of the people in developing countries who are dependent on reefs for food, for tourism, and for protecting the land they live on (The Global Coral Reef Monitoring Network, 2008).
*****
These up-to-date reports on global climate change, taken together, are overwhelming evidence that the world is far beyond dangerous climate interference and into a dire state of emergency.
This is all the more so as all of the above feedbacks and factors exacerbate other ongoing regional and global environmental degradations.
Also, the most climate change vulnerable populations will be impacted first and hardest, because of the ongoing regional socio-economic deprivations of these populations (who are also the most climate change innocent).
The only response is an international emergency response, cutting global GHG emissions as soon and as quickly as possible.
In order for the planet to sink carbon, our greenhouse gas emissions from fossil fuels must be cut to virtually zero. But even this now will not be enough. We must develop artificial carbon sinks, as well, to enhance the removal of CO2 from the atmosphere.
These are the bottom line essentials of the emergency response.
*****
*N.B. The 2007 assessment by the Intergovernmental Panel on Climate Change, on which negotiations under the United Nations Framework Convention on Climate Change are based, included only research papers published before 2006 — limiting the scientific basis for current and future UNFCCC negotiations before 2015 — and did not include many carbon feedbacks.
Go to the Climate Change Emergency References Page


